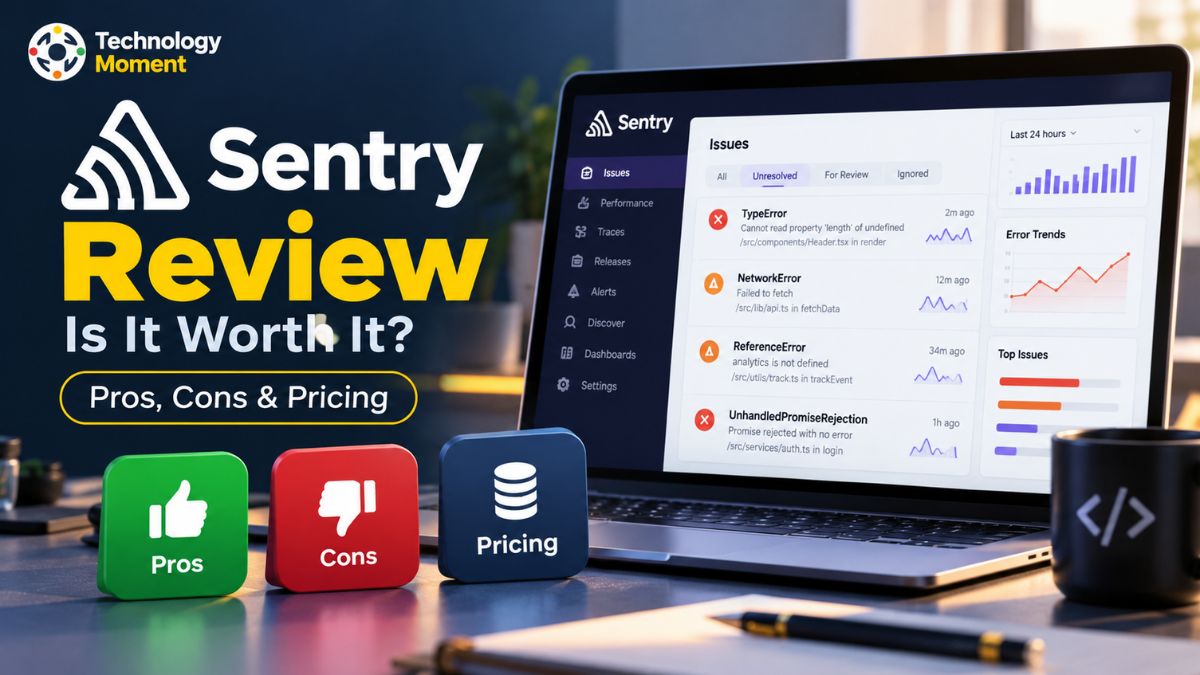
When an application starts throwing errors, pages load slowly, or users encounter unexpected crashes, developers need more than a notification that something has gone wrong. They need clear insights into what caused the problem and how to fix it. This is where Sentry comes into the picture. In this Sentry review, Technology Moment explores how the platform helps development teams monitor application errors, investigate performance issues, and improve the reliability of their software.
Sentry is a developer-focused monitoring platform that brings error tracking, performance monitoring, stack traces, and debugging context into one place. Instead of manually searching through logs or trying to reproduce every issue, developers can use Sentry to identify related errors, examine application behavior, and understand which problems deserve attention first. It supports a wide range of development environments, making it relevant for frontend developers, backend engineers, startups, and established software teams.
Another area worth exploring is Sentry’s AI-assisted debugging. Its Seer capabilities use available issue and application context to help investigate potential root causes and suggest fixes. For teams managing complex applications, these features may help streamline debugging workflows, although developers should still review suggested solutions before applying them.
However, useful features alone do not determine whether a tool is the right investment. Pricing, usage limits, setup requirements, integrations, and the needs of your development team all matter. A tool that works well for a growing SaaS business may not be necessary for a small project. At Technology Moment, our goal is to help readers make informed technology decisions through practical, balanced reviews. This guide examines Sentry’s key features, pricing, pros and cons, and leading alternatives so you can decide whether it fits your application monitoring and debugging needs.
What Is Sentry Review?
Sentry is an application monitoring and error tracking platform designed to help developers identify, investigate, and resolve software problems. When an application crashes, a page fails to load, or an API request produces an unexpected result, developers need enough technical information to understand what happened. Sentry collects relevant error events and presents them in a dashboard, helping engineering teams investigate issues without relying entirely on manual log searches. This makes Sentry useful for web applications, mobile apps, backend services, and SaaS products that need reliable error monitoring.
One of the main purposes of Sentry error tracking is to connect an error message with the technical context needed to investigate it. Depending on the SDK, configuration, and available event data, developers can examine stack traces, request details, application releases, and related events. Stack traces help identify where an error occurred in the code, while source maps can make production JavaScript errors easier to understand. Sentry also groups similar errors into issues, reducing the need to investigate every occurrence separately. Teams can then prioritize problems, assign responsibility, and monitor whether an issue returns after a fix.
Beyond error tracking, Sentry offers performance monitoring and distributed tracing to help developers investigate slow transactions, requests, and application operations. Session Replay can provide additional context about user interactions surrounding supported errors. These capabilities bring several parts of application debugging into a connected workflow rather than treating every problem as an isolated event. Sentry also offers Seer, an AI debugging agent that can analyze issue context and help developers investigate root causes and potential fixes.
Sentry is not a replacement for every logging, infrastructure monitoring, or project management tool. Its strongest appeal is to developers who want detailed visibility into application errors and performance. Startups may use it to troubleshoot production issues, while larger engineering teams can use it to improve incident investigation across multiple services. Whether Sentry is the right choice depends on the application’s complexity, required integrations, data volume, and monitoring budget.
Sentry Features: What Does It Offer?
Sentry combines error tracking, performance monitoring, debugging context, and alerting to help developers understand problems throughout the software development lifecycle. Its features are particularly useful when an issue appears in production and cannot be reproduced easily on a developer’s machine. Error tracking and exception monitoring are central to the platform. Sentry can capture supported application exceptions, collect event details, and group related errors into issues. Developers can review when an error occurred, which release was involved, and which users or environments were affected when that information is available. This helps teams distinguish recurring problems from isolated events and prioritize fixes based on their impact.
Stack traces and debugging workflows provide more technical context. Stack traces identify the sequence of function calls associated with an error, while source maps can translate minified JavaScript locations into more readable source references. Release tracking helps teams investigate whether a new deployment introduced a regression. These capabilities can shorten the path from identifying an error to finding the relevant code. Performance monitoring and distributed tracing help developers investigate slow requests, transactions, and service interactions. Rather than focusing exclusively on crashes, teams can examine latency and trace information to identify potential bottlenecks. Application performance monitoring is especially valuable for SaaS products where slow responses can affect the user experience.
Session Replay and alerting add further visibility. Session Replay can help developers understand relevant user interactions before an issue occurs, subject to configuration and data availability. Alerts can notify teams about important errors or performance problems, while issue management supports investigation and resolution.
Sentry also offers Seer, its AI debugging agent, which uses available issue details, traces, logs, profiles, and connected code context to help investigate root causes and suggest fixes. AI agent monitoring provides visibility into supported LLM calls, tool executions, timing, and related trace information. These features are useful for teams building AI-powered applications, but AI-generated suggestions still require appropriate verification. Sentry’s key advantage is the way it connects errors with performance data and debugging context. The practical value depends on the frameworks, integrations, and features a team actually uses.
Sentry Pricing and Plans
Sentry offers a free entry point and paid plans for teams that need greater usage allowances, collaboration features, and monitoring capabilities. Its pricing is important to evaluate because the total cost can depend on the plan, included event volumes, and additional services. The free plan can help developers test error tracking before committing to a paid subscription, while growing applications may need more capacity for errors, logs, tracing, and session replay.
The following comparison summarizes the main plan options and publicly listed base prices found in Sentry’s pricing materials. Treat these amounts as reference prices rather than a guaranteed checkout quote, because current pricing, billing terms, quotas, and regional taxes may change.
| Pricing factor | Developer (Free) | Team | Business | Enterprise |
|---|---|---|---|---|
| Reference base price | $0 | $29/month | $89/month | Custom pricing |
| Best suited for | Individual developers and small projects | Small engineering teams | Growing organizations | Large or complex organizations |
| Error tracking | Included within plan limits | Higher-capacity paid offering | Paid monitoring offering | Tailored to organizational needs |
| Performance monitoring | Included features subject to quotas | Expanded usage allowances | Expanded monitoring and team capabilities | Enterprise-scale requirements |
| Logs and tracing | Limited by plan allowances | Included allowances apply | Included allowances apply | Discussed with Sentry |
| Session Replay | Subject to plan limits | Included allowance | Included allowance | Depends on agreement |
| Collaboration | Core developer workflow | Team collaboration features | Additional management and monitoring capabilities | Enterprise administration options |
| Support and administration | Standard self-service options | Team-oriented features | Additional organizational controls | Enterprise support options may be available |
| Best reason to upgrade | Need more usage or capabilities | Need shared workflows and more capacity | Need broader controls and monitoring | Need tailored scale, security, or support |
One additional cost to consider is Seer, Sentry’s AI debugging agent. Sentry’s published 2026 information lists Seer at $40 per active contributor per month on eligible paid plans. An active contributor is a user who opens at least two pull requests during the billing month in a connected repository where the relevant Seer features are enabled.
Before choosing a plan, estimate monthly error events, tracing volume, log ingestion, session replay usage, and any AI add-ons. Check the current official Sentry pricing page for exact quotas, billing terms, and available features. This will help you compare the actual cost of Sentry with your monitoring requirements rather than relying on the base price alone.
Pros and Cons of Sentry
Sentry is a developer-focused error tracking and application monitoring platform that helps teams investigate software errors, identify performance issues, and improve application reliability. Its biggest advantage is the amount of debugging context it can provide when something goes wrong in production. Instead of relying only on error messages or manually searching through application logs, developers can examine stack traces, issue history, release information, and other available event data in one place. This makes Sentry particularly useful for teams maintaining web applications, mobile apps, APIs, and SaaS products.
One of the main pros of Sentry is its combination of error tracking and performance monitoring. Developers can investigate exceptions, group similar errors, track regressions, and analyze slow transactions. Session Replay can provide additional context about user interactions, while release tracking helps teams determine whether a new deployment may have introduced a problem. Sentry also supports numerous programming languages and frameworks through its SDKs, making it practical for different development environments. Its AI-assisted debugging capabilities, including Seer, add another way to investigate root causes and explore possible fixes. However, AI-generated suggestions should always be reviewed before implementation.
Despite these benefits, Sentry has limitations. Its extensive feature set may be unnecessary for a small project that only needs basic error notifications. Developers may need time to configure SDKs, source maps, tracing, alerts, and integrations correctly. Teams also need to monitor event volumes and usage limits because higher application traffic can increase monitoring costs. In addition, collecting too much telemetry without effective filtering can create noisy dashboards and unnecessary alerts. Some advanced workflows may require technical knowledge that nontechnical users do not have.
Overall, Sentry is worth considering when reliable debugging, production error monitoring, and performance visibility are important to a development team. Before selecting a plan, evaluate the features you will actually use, your expected event volume, and the time required to maintain the monitoring setup. This balanced assessment is more useful than judging Sentry solely by its feature list.
Sentry vs Datadog vs New Relic vs Bugsnag vs Rollbar
Sentry, Datadog, New Relic, Bugsnag, and Rollbar all help development teams understand application problems, but they differ in their primary focus. Sentry emphasizes developer-oriented error tracking, debugging context, and application performance monitoring. Datadog offers a broader observability platform that connects application errors with infrastructure metrics, logs, traces, and other operational data. New Relic also provides application performance monitoring and wider telemetry analysis, making it relevant to teams that want to investigate application behavior alongside system performance.
Bugsnag, also associated with SmartBear’s Insight Hub product branding, is particularly relevant to teams interested in application stability, crash reporting, and release health. Rollbar focuses on error monitoring, issue grouping, and production debugging workflows. The best choice depends on whether your priority is investigating code-level errors, monitoring an entire infrastructure stack, tracking mobile application stability, or maintaining a focused error monitoring workflow. Product capabilities can vary by plan and integration, so the comparison below is intended as a practical selection guide rather than a claim that every feature is available in every tier.
| Comparison factor | Sentry | Datadog | New Relic | Bugsnag / Insight Hub | Rollbar |
|---|---|---|---|---|---|
| Primary focus | Error tracking and developer observability | Full-stack observability | APM and telemetry analysis | Application stability and error monitoring | Error tracking and debugging |
| Error tracking | Core capability | Available within broader platform | Available through error monitoring features | Core capability | Core capability |
| Stack traces | Strong debugging context | Available with supported error data | Available with supported error data | Supports error investigation | Supports error investigation |
| Performance monitoring | Application tracing and performance insights | Broad infrastructure and application monitoring | Broad APM and telemetry | Capabilities depend on product and plan | More focused error monitoring capabilities |
| Infrastructure monitoring | More limited than full-stack platforms | Major strength | Major strength | Not its primary differentiator | Not its primary differentiator |
| Release health | Release tracking and regression workflows | Deployment and service context through integrations | Application and deployment context | Particularly relevant to stability analysis | Release and error workflows |
| Session replay | Available, subject to configuration and plan | Requires relevant products or integrations | Depends on relevant products and integrations | Verify current offering | Verify current offering and plan |
| AI capabilities | Seer and AI-assisted debugging | AI and automation capabilities across relevant products | AI-assisted observability capabilities | Verify current product features | Verify current product features |
| Pricing approach | Plan allowances and usage-based considerations | Product selection and usage-based billing | Usage and data-ingestion considerations | Check current commercial quote | Check current plan and usage terms |
| Best suited for | Developers who need detailed debugging | Teams monitoring complex infrastructure | Teams needing broad application observability | Teams prioritizing application stability | Teams needing focused error monitoring |
The practical difference is scope. Sentry is a strong candidate when developers want detailed error reports without necessarily adopting a comprehensive infrastructure monitoring suite. Datadog and New Relic are worth evaluating when a team needs to correlate application problems with infrastructure, logs, and distributed services. Bugsnag may appeal to mobile teams focused on crash-free experiences and release stability, while Rollbar may suit teams prioritizing straightforward error grouping and investigation.
Pricing should be compared using expected monthly usage, retention, included features, and the cost of additional telemetry. There is no universal winner: a broader platform can justify its cost for a complex production environment, while a focused tool may be more practical for a smaller development team. Check each vendor’s current documentation and pricing before making a final decision.
Best Sentry Alternatives
Although Sentry offers a broad set of developer monitoring features, it may not be the best fit for every project. Some teams need a less expensive error monitoring solution, while others want open-source software, self-hosting, deeper infrastructure visibility, or a stronger connection between errors and user sessions. Choosing among the best Sentry alternatives starts with identifying which of these requirements matters most. The goal is not simply to find another tool with similar features, but to select one that fits your application’s architecture, budget, and debugging workflow.
Datadog is worth considering when error tracking needs to be part of a wider observability strategy. It connects application monitoring with infrastructure metrics, logs, and distributed traces, which can help teams investigate problems spanning multiple services. However, its broader capabilities may introduce additional complexity and costs for teams that only require basic error tracking.
New Relic is another option for organizations that need application performance monitoring alongside logs, traces, and other telemetry. It can be useful when engineering teams want a broader view of application health. As with Datadog, the value depends on whether the organization will use the additional monitoring capabilities.
Bugsnag, associated with SmartBear’s Insight Hub branding, is relevant to teams that prioritize crash reporting, application stability, and release health, particularly in mobile development. Check the current product name, available integrations, and plan details before comparing it with Sentry.
Rollbar is an alternative for teams that want to capture application errors, group related occurrences, and manage debugging workflows. It is worth evaluating when the priority is focused error monitoring rather than a complete infrastructure observability platform.
LogRocket is particularly useful for teams investigating frontend issues because session replay can help developers understand the user interactions surrounding a problem. It may be a better fit when reproducing user-facing bugs is a major challenge.
Honeybadger is worth considering for smaller development teams that prefer a focused monitoring product covering errors and related operational checks. Its simplicity may appeal to teams that do not need a large observability suite.
GlitchTip is an option for teams interested in open-source error tracking and self-hosting. Its compatibility with Sentry SDKs can make migration easier in suitable setups, although feature coverage differs from Sentry and should be checked before switching.
The right Sentry alternative ultimately depends on your requirements. Choose Datadog or New Relic when broad observability is important, investigate Bugsnag when application stability is a priority, consider Rollbar for focused error tracking, explore LogRocket for session-based frontend debugging, and evaluate Honeybadger or GlitchTip when simpler workflows or self-hosting are more attractive. Compare current pricing, feature limits, integrations, data handling, and migration effort before committing to a platform.
How Easy Is Sentry to Set Up and Use?
Sentry is designed to make error tracking accessible to developers without requiring them to build a complete monitoring system from scratch. The initial setup is generally straightforward for supported frameworks: create a Sentry account, select a project, install the relevant SDK, configure the Data Source Name (DSN), and verify that events reach the dashboard. Sentry provides setup instructions and guided configuration options for popular technologies, including JavaScript, React, Python, Node.js, Java, and mobile development environments. The exact installation steps depend on the framework and project structure.
For example, a React developer can install the appropriate Sentry SDK through a package manager and initialize it in the application’s entry point. A Python developer can install the official sentry-sdk package and configure it within the application. After setup, developers can generate a test exception to confirm that error tracking works correctly. Sentry can then collect supported errors and display relevant information, such as stack traces and event details.
However, installing Sentry is only the first step. A reliable production setup may require additional configuration for source maps, release tracking, performance monitoring, distributed tracing, and alert rules. Developers should also configure sampling rates appropriately because capturing every transaction or session may not be necessary for every application. Privacy settings deserve attention as well, particularly when collecting user context or enabling Session Replay. Sensitive information should be masked or excluded according to the application’s requirements and applicable privacy obligations.
The dashboard helps users review issues, filter events, identify recurring errors, and follow problems through their debugging workflow. Teams can also use integrations and notifications to connect error monitoring with their existing development processes. Advanced features, however, require some familiarity with application architecture and observability concepts.
Overall, Sentry is relatively easy to get started with if you have basic programming experience. Beginners may need additional time to understand SDK configuration, stack traces, and performance data, but the official documentation provides a useful starting point. The most effective approach is to begin with error tracking, verify the setup, and enable additional monitoring features as your application’s needs grow.
Who Should Use Sentry?
Sentry is most useful for people and organizations that develop, maintain, or operate software applications and need a practical way to investigate errors. Its combination of error tracking, performance monitoring, stack traces, and release information can help teams understand why software behaves unexpectedly. However, the value it provides depends on the application’s complexity and how frequently developers need to troubleshoot production issues.
Individual developers and freelancers may benefit from Sentry when maintaining client websites, mobile applications, or independent software products. Error tracking can help them discover problems that do not appear during local testing. The free plan can be a starting point for eligible projects, although developers should review the current usage limits before relying on it for production monitoring.
Startups and small SaaS businesses can use Sentry to identify bugs affecting customers, investigate failed requests, and monitor application performance after deployments. For a small engineering team, having error details and release context in one place can make troubleshooting more organized. As traffic grows, the team should assess event volumes, retention needs, and subscription costs.
Frontend and backend developers have different but complementary reasons to use Sentry. Frontend engineers can investigate JavaScript errors, supported session replays, and user-facing performance issues. Backend engineers can examine exceptions, API failures, and supported distributed traces. Teams working across multiple services may benefit from connecting these signals to understand how a problem moves through an application.
Mobile developers may use Sentry to investigate crashes, exceptions, and performance issues in supported iOS, Android, Flutter, or React Native projects. Release information and crash context can help them identify whether a particular version introduced a regression.
AI application developers may find Sentry’s AI agent monitoring and Seer debugging capabilities useful when investigating failures, latency, or unexpected behavior in supported AI workflows. These capabilities can provide additional context, but they do not remove the need for testing and human review.
Sentry may be less suitable for teams that only need simple uptime checks, have very limited monitoring requirements, or require comprehensive infrastructure monitoring as their primary capability. In those situations, a simpler tool or a broader observability platform may be a better fit. Ultimately, Sentry is worth evaluating when faster debugging, production visibility, and application reliability are important priorities.
Frequently Asked Questions About Sentry
What Is Sentry Software Used For?
Sentry is used to track application errors, investigate exceptions, and monitor software performance. Developers can examine stack traces, group related issues, review release information, and investigate supported performance traces. Depending on configuration, Sentry also provides Session Replay, alerting, and AI-assisted debugging features. It is commonly used by teams maintaining web applications, APIs, mobile apps, and SaaS products that need better visibility into production problems.
Is Sentry Free to Use?
Yes, Sentry offers a free Developer plan for getting started with error tracking and supported monitoring features. However, the free plan has usage allowances and feature limitations, so it may not meet every production application’s requirements. Developers should review current event quotas, performance monitoring limits, and other included capabilities before choosing a plan. Paid subscriptions may be appropriate when an application needs greater capacity or additional team features.
How Much Does Sentry Cost?
Sentry’s cost depends on the selected subscription, included usage allowances, and the monitoring features required. Its published plans include a free option and paid Team, Business, and Enterprise offerings. Additional usage or optional capabilities may affect the total bill. Because pricing and quotas can change, consult the official Sentry pricing page for current subscription costs, included events, and billing conditions before making a purchasing decision.
What Are the Main Features of Sentry?
Sentry’s main features include error tracking, exception monitoring, stack traces, release tracking, performance monitoring, distributed tracing, alerting, and issue management. Session Replay can provide context about supported user interactions, while Seer offers AI-assisted debugging capabilities. Available functionality depends on the SDK, configuration, subscription, and product integrations. Together, these features help developers identify errors, investigate root causes, and understand how software problems affect application performance and users.
What Are the Pros and Cons of Sentry?
Sentry’s advantages include detailed error reports, useful debugging context, performance monitoring, release tracking, and integrations with developer workflows. Its limitations include usage-based cost considerations, configuration requirements, and a learning curve for advanced monitoring features. Large event volumes can also require careful filtering and alert management. Sentry is particularly useful when developers need detailed application debugging, but simpler projects may not require its full feature set.
What Are the Best Sentry Alternatives?
Popular alternatives include Datadog, New Relic, Bugsnag, Rollbar, LogRocket, Honeybadger, and GlitchTip. Datadog and New Relic are worth considering for broader observability, while Bugsnag focuses on application stability and Rollbar offers error monitoring workflows. LogRocket can help with frontend debugging through session replay. Honeybadger and GlitchTip may suit teams seeking focused monitoring or open-source options. Compare current features, pricing, integrations, and hosting requirements before switching.
Does Sentry Support Performance Monitoring?
Yes, Sentry provides performance monitoring for supported applications. Developers can investigate transaction durations, latency, and distributed traces to understand where performance problems may occur. Depending on the SDK and instrumentation, this can help identify slow requests, service interactions, and potential bottlenecks. Performance monitoring complements error tracking by helping teams investigate applications that are slow or inefficient even when they do not produce an obvious exception.
Does Sentry Offer AI-Assisted Debugging?
Yes, Sentry offers Seer, an AI debugging agent that uses available issue details and application context to investigate potential root causes and suggest fixes. Its capabilities can help developers prioritize problems and explore possible solutions more efficiently. Results still require human review because suggested fixes may be incomplete or unsuitable for a particular codebase. Access and billing depend on Sentry’s current subscription terms and Seer pricing rules.